This worksheet is designed to help you understand two-way frequency tables and how to use them to calculate percentages. Let’s break down what that means:
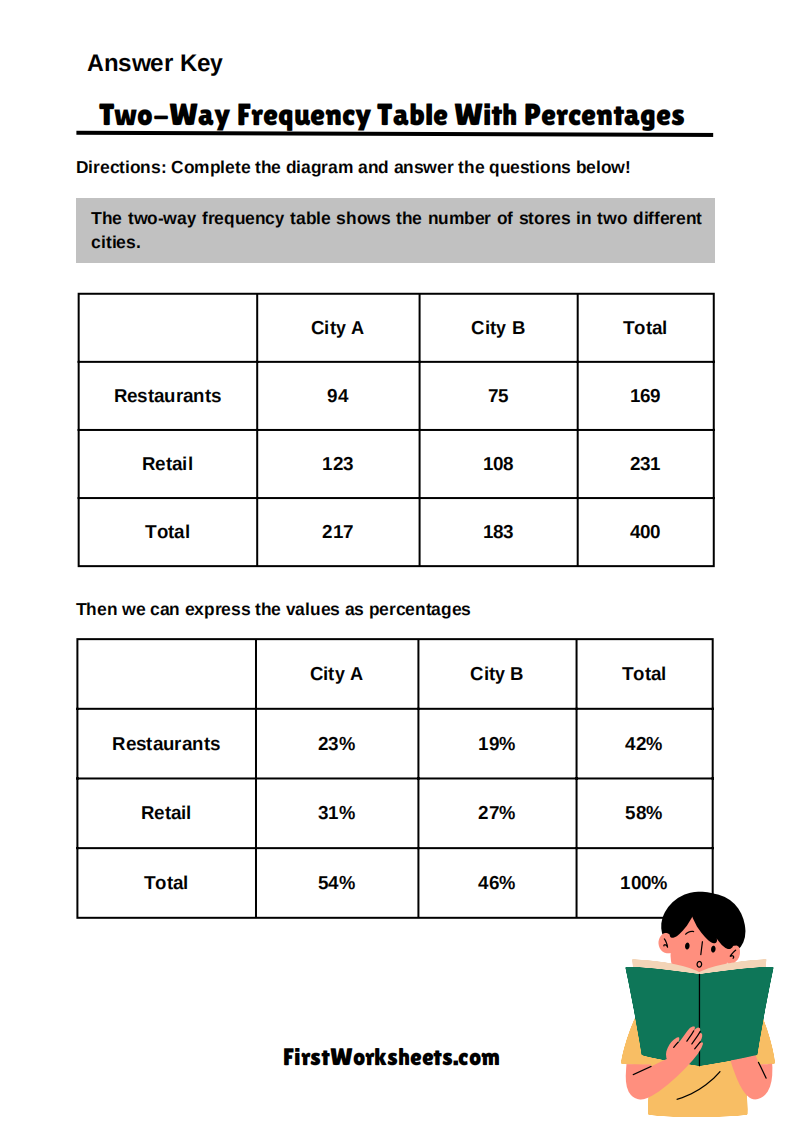
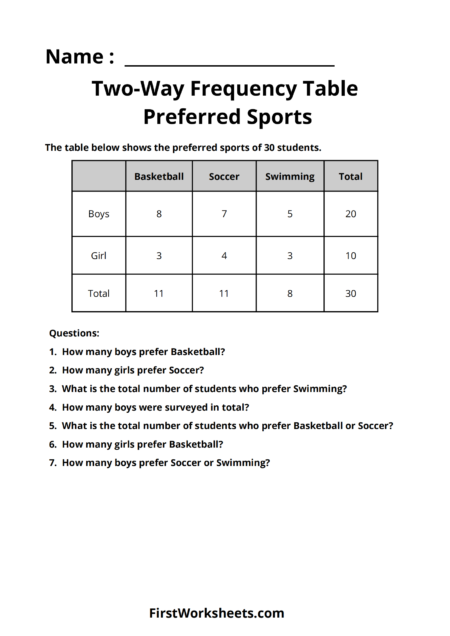
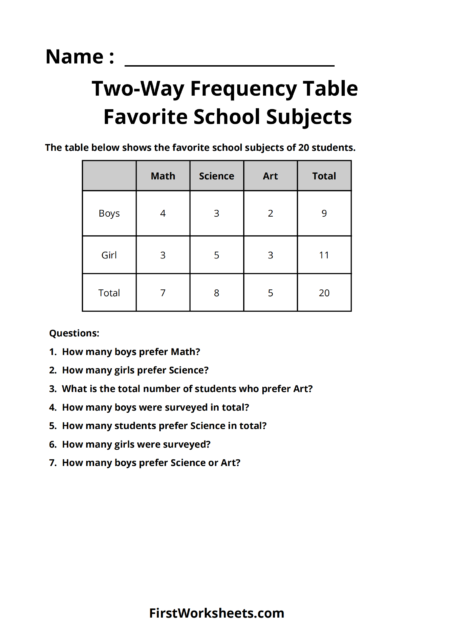
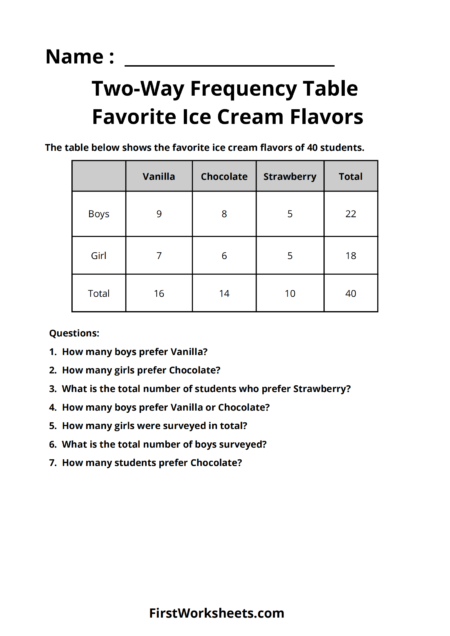
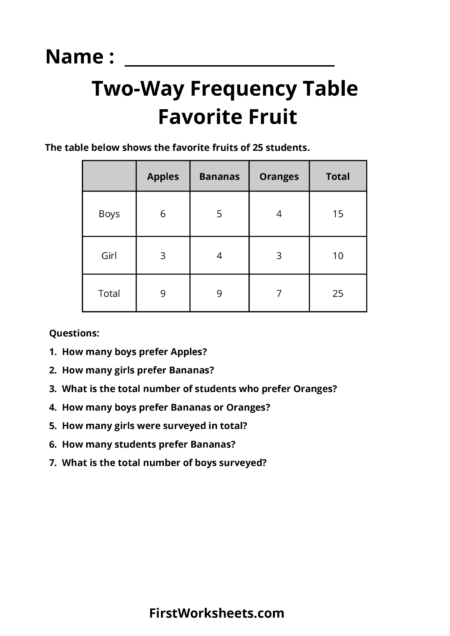
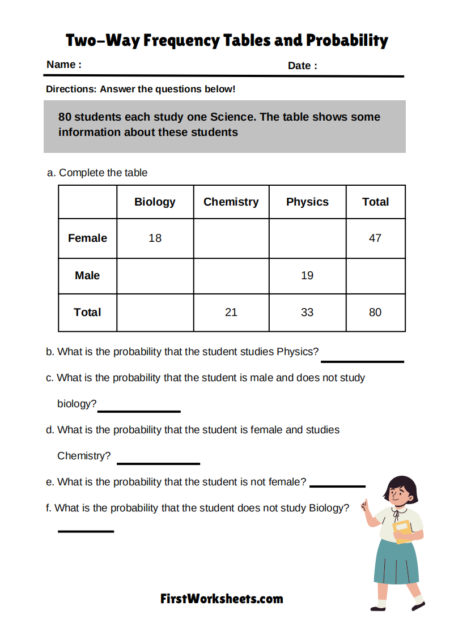
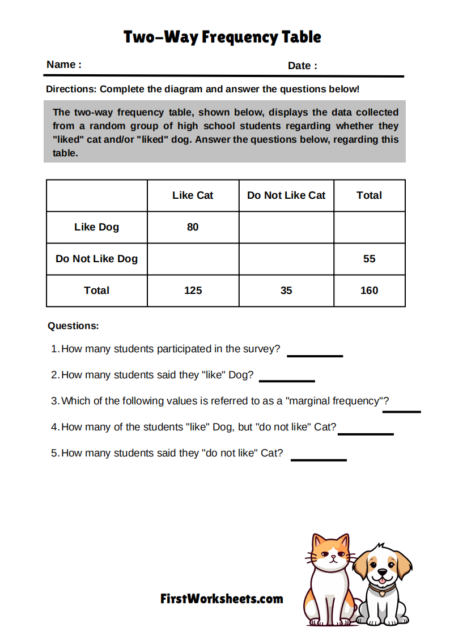
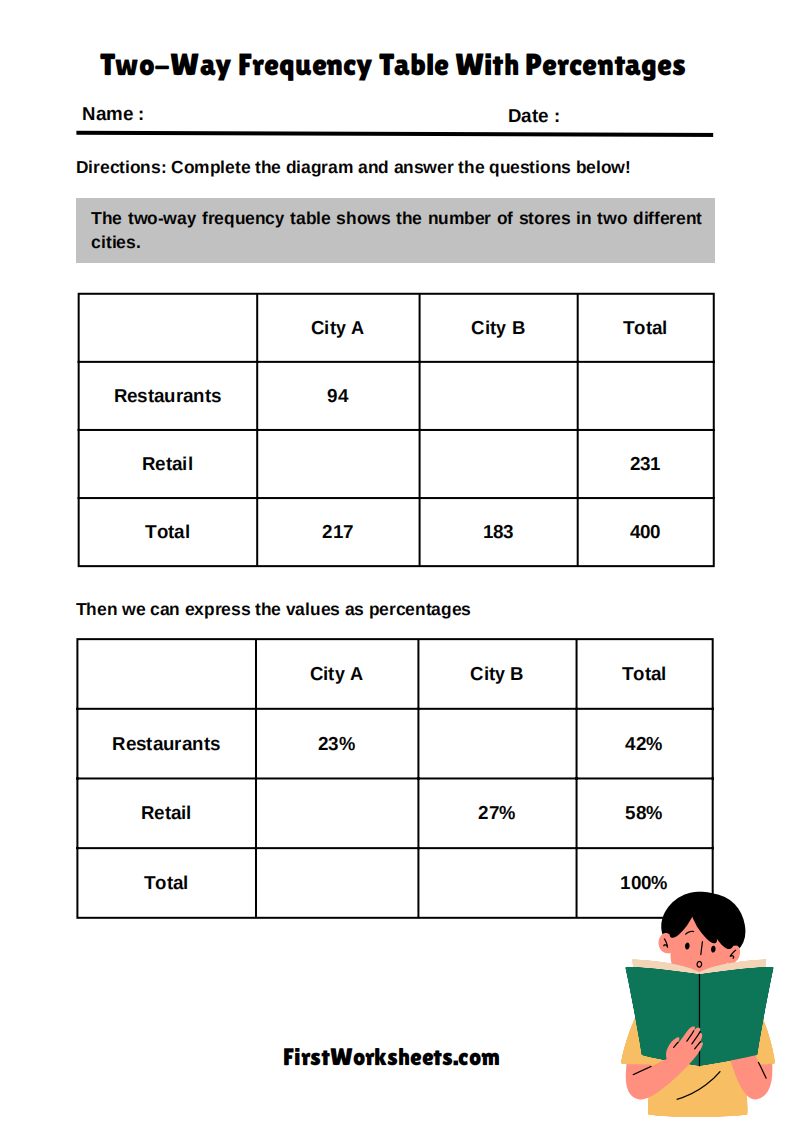
- Two-Way Frequency Table: This is a chart that displays the frequencies of two different categories across two other categories. In this case, the categories are the types of stores (restaurants or retail) and the cities where they are located (City A or City B).
- Percentages: Percentages show a part of a whole as a number out of 100. In this table, the percentages help us understand the proportion of each type of store in each city, as well as the overall distribution of stores.
Purpose of the Worksheet
The main goal of this worksheet is to help you practice:
- Completing a two-way frequency table: You’ll fill in missing values in the table based on the information given. This involves adding up numbers in rows and columns.
- Calculating percentages within a table: You’ll determine the percentage of each type of store in each city and the overall percentage of stores in each category. This helps you see the relative sizes of different groups within the data.
- Interpreting the data: By looking at the completed table and percentages, you can answer questions about the distribution of stores in the two cities. For example, you could figure out which city has more restaurants or a higher percentage of retail stores.
Let me know if you’d like to try an example together!
Answer Key
