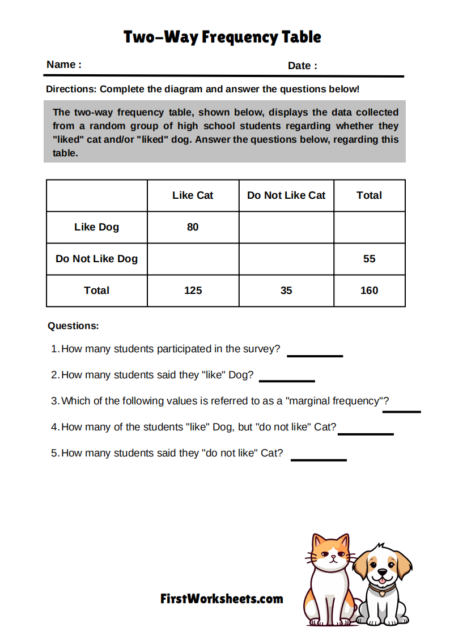
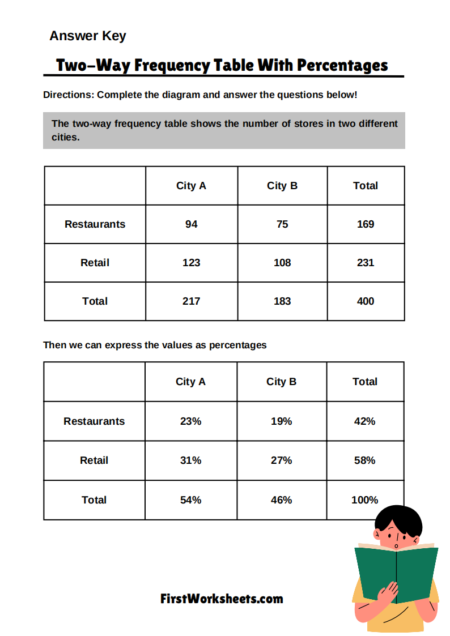
This worksheet is a tool for organizing and understanding data about student preferences.
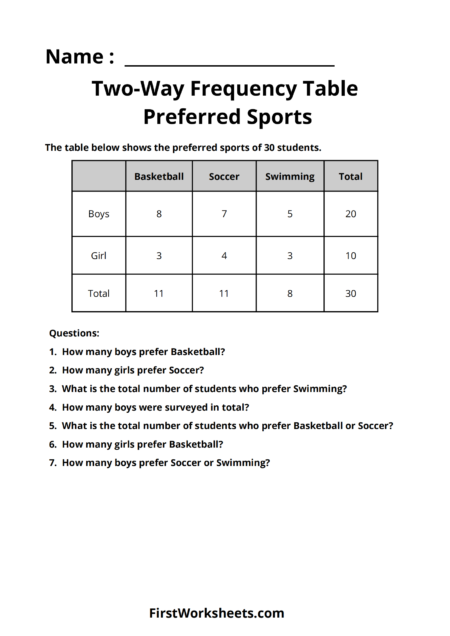
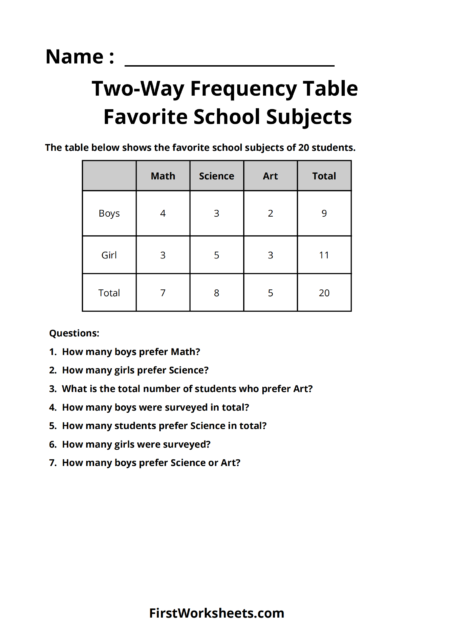
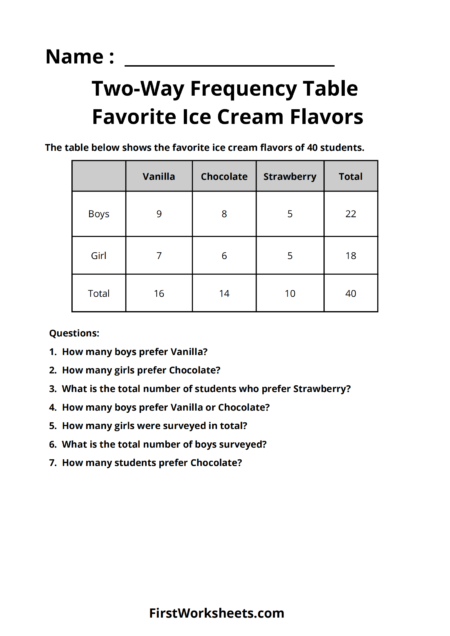
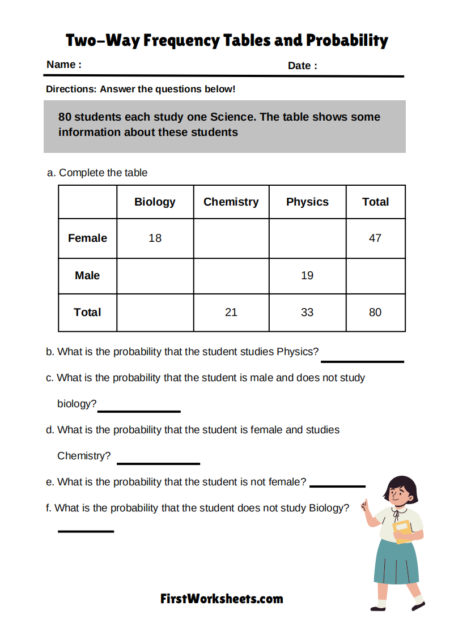
The core of the worksheet is a table that displays information in two dimensions or ways:
The type of fruit students prefer (Apples, Bananas, Oranges).
The gender of the students (Boys, Girls).
This type of table is called a “Two-Way Frequency Table” because it shows us how frequently (or how often) certain combinations of these two categories occur. For example, it tells us how many boys prefer apples, how many girls prefer bananas, and so forth.
The table also includes “Total” rows and columns. These give us a quick overview of the total number of students who prefer each fruit and the total number of boys and girls surveyed.
Purpose and Educational Value
- Data Organization: The table provides a structured and visual way to present data. This makes it much easier to analyze and understand compared to a list of individual preferences.
- Identifying Patterns and Relationships: The table allows us to see if there are any connections or trends between fruit preferences and gender. For instance, we can see if boys tend to prefer a certain fruit more than girls.
- Answering Questions: The worksheet includes a set of questions that require students to extract specific information from the table. This helps them practice reading and interpreting data accurately.
- Developing Data Analysis Skills: Students are essentially learning the basics of data analysis. They’re practicing:
- Counting and calculating frequencies (how many students fit into each category).
- Comparing different categories.
- Drawing conclusions based on the data.
- Real-World Application: The use of a familiar topic like fruit preferences makes the concept of data analysis more relatable and engaging for students. It demonstrates how data analysis can be used to understand real-world situations.
- Foundation for Further Learning: This worksheet provides a stepping stone to more complex statistical concepts. The skills learned here will be valuable in higher-level math and science courses.

Answer Key

